Compare MT5 Backtests — KPI Head-to-Head
Compare up to 5 MetaTrader 5 backtests in one structured KPI cross-table. See profitability, risk, drawdown, and stability metrics side-by-side — then get an AI comparison analysis report with strengths, weaknesses, and a clear conclusion on which EA performs best.
No spreadsheets. No manual comparison. Just structured decision-making for your MT5 Strategy Tester results.
Quick Navigation
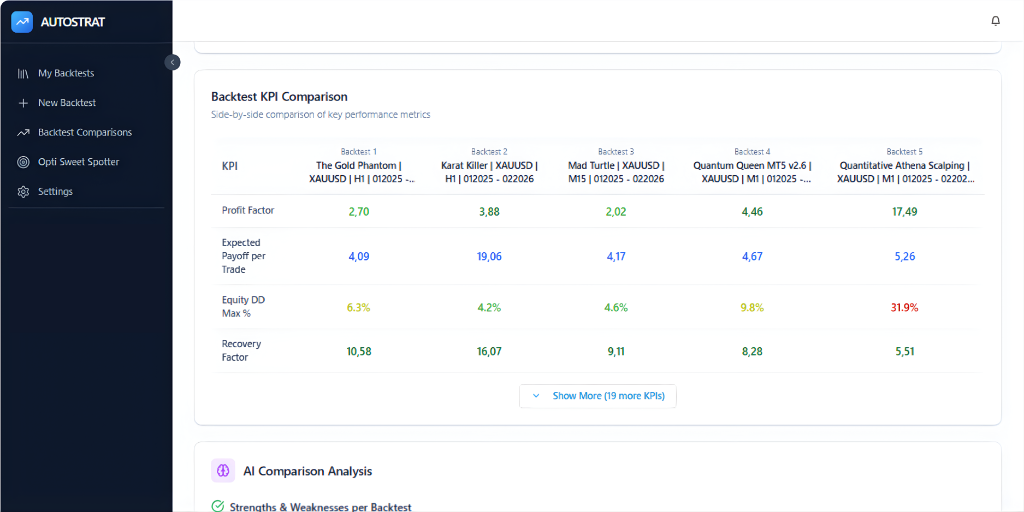
Backtest KPI Comparison – See Every MT5 Metric Side-by-Side
AUTOSTRAT lets you compare up to five MetaTrader 5 Strategy Tester backtests in one structured KPI cross-table.
Instead of switching between reports, you see performance, risk, and trade stability metrics row-by-row — for every backtest, on the same screen.
Each KPI is aligned with the same definitions used in Backtest Analysis, so you're not comparing "raw numbers" — you're comparing interpreted metrics.
If you want to understand what each KPI means, open the MT5 Backtest Analysis page where all metrics are defined and explained.
Why This KPI Cross-Table View Is So Powerful
- See instantly which EA is best per metric (Profit Factor, Drawdown, Sharpe, Recovery, etc.)
- Spot trade-offs fast: strong profit but weak stability, low drawdown but low edge
- Same KPI set and structure across all backtests for fair comparison
- Replace manual Excel comparison with a clean, decision-ready table
AI Comparison Analysis – Strengths, Risks, and a Clear Winner
After comparing your backtests, AUTOSTRAT generates an AI Comparison Report that summarizes what matters — not just what's different.
The report highlights:
- Which strategy looks structurally strongest
- Which backtest has hidden risk signals
- Where KPIs conflict between candidates (example: high profit but unstable equity curve)
- Which strategy is likely overfitted vs robust
- What to test next to validate the result (more data, different symbol/timeframe, more trades)
The outcome is simple: less guessing, a clearer decision — which EA version is worth keeping, improving, or discarding.
What You Can Compare with AUTOSTRAT
The KPI cross-table makes any backtest combination consistent and comparable:
- Different EA versions (same strategy, new settings)
- Different input settings (risk, filters, parameters)
- Different symbols (e.g. XAUUSD vs US30)
- Different timeframes (M5 vs H1)
- Different date ranges / market regimes (2020–2021 vs 2024–2025)
The KPI table makes this consistent and comparable — even if the tests use completely different conditions.